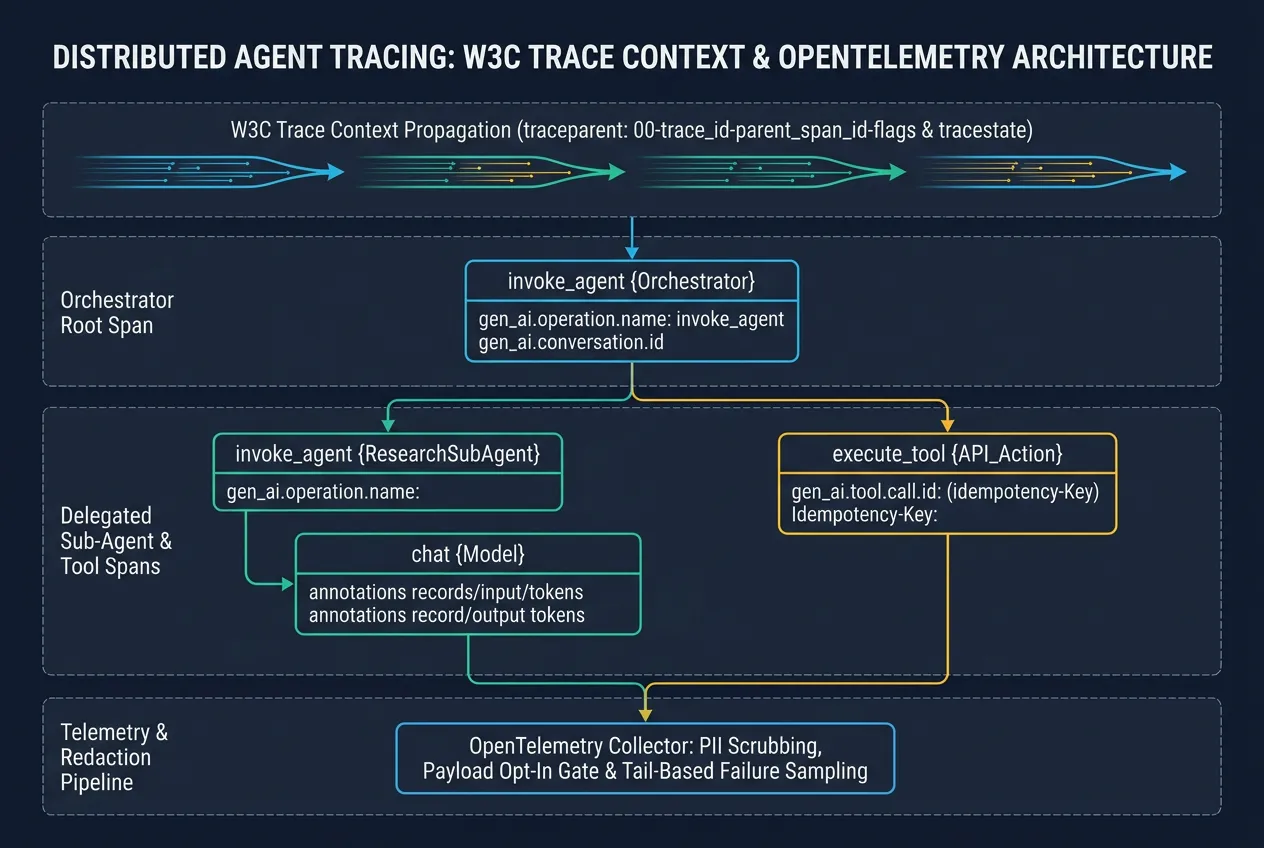
Distributed agent tracing is the observability architecture that propagates unified cryptographic trace contexts and standardized semantic telemetry across autonomous orchestrators, delegated sub-agents, model inference calls, and external tool executions. By combining W3C Trace Context headers (traceparent and tracestate) with OpenTelemetry GenAI semantic conventions (invoke_agent and execute_tool), engineering teams can reconstruct causal execution DAGs, isolate silent reasoning failures, enforce idempotency boundaries, and maintain zero-retention privacy compliance across complex multi-agent deployments.
Why Do Traditional APM Traces Break in Multi-Agent Architectures?
Traditional application performance monitoring (APM) assumes deterministic request-response call graphs where an incoming HTTP request traverses synchronous microservices and returns a status code. Autonomous agent topologies violate these assumptions across three structural dimensions:
- Asynchronous Sub-Agent Handoffs: When a supervisor agent delegates research or execution subtasks across asynchronous message queues, actor frameworks, or Agent-to-Agent (A2A) RPC boundaries, implicit thread-local context is lost unless explicitly serialized and extracted at every boundary.
- Probabilistic Control Flow Loops: Unlike deterministic code paths, an agent may dynamically retry a tool call, pivot its reasoning strategy mid-turn, or spawn parallel speculative branches. Without explicit causal parent-child span linking, telemetry backends see disconnected model invocations rather than a coherent reasoning trajectory.
- Silent Semantic Failures: A model inference call or external API execution can return an HTTP
200 OKstatus while delivering hallucinated parameters, truncated context, or an authorization refusal embedded in natural language. Standard infrastructure traces mark the span healthy while the downstream workflow corrupts state.
As detailed in our analysis of Multi-Agent State Synchronization Protocols, preventing context drift across distributed orchestrators requires binding every state mutation to a verifiable, end-to-end execution trace.
How Does W3C Trace Context Propagate Across Agent Boundaries?
To unify telemetry across heterogeneous runtimes, production architectures enforce the W3C Trace Context specification as the mandatory transport envelope across all in-process and remote boundaries.
Every agent invocation, message queue payload, and tool call header carries two standardized fields:
traceparent: Contains the version (00), a globally unique 16-bytetrace-idshared by every operation in the workflow, an 8-byteparent-ididentifying the immediate upstream caller span, and 1-bytetrace-flagsgoverning sampling decisions.tracestate: Carries vendor-neutral key-value pairs across multi-tenant boundaries—enabling platforms to attach routing tier metadata, tenant isolation tags, or cost-attribution budgets without mutating the core trace identity.
When an orchestrator spawns parallel sub-agents or dispatches background tasks, the child worker extracts the incoming traceparent, initializes an active child span bound to the upstream trace-id, and injects its newly generated span ID into all downstream model and tool calls. If an agent pauses for human-in-the-loop authorization or durable checkpointing, persisting the traceparent alongside the checkpoint state ensures that resumed execution attaches cleanly to the original causal tree.
How Do OpenTelemetry GenAI Semantic Conventions Structure Agent Telemetry?
To eliminate fragmented custom logging schemas, the OpenTelemetry GenAI Semantic Conventions establish a strict taxonomy for agentic operations. Every span in an agent workflow must declare gen_ai.operation.name to distinguish orchestration logic from raw model inference and external side effects.
Span Operation (gen_ai.operation.name) | Span Naming Pattern | Core Required & Recommended Attributes | Architectural Purpose |
|---|---|---|---|
invoke_agent | invoke_agent {gen_ai.agent.name} | gen_ai.agent.id, gen_ai.agent.name, gen_ai.conversation.id | Bounds an entire agent turn or sub-agent delegation, aggregating child inference calls, latency, and token budgets. |
chat / generate_content | chat {gen_ai.request.model} | gen_ai.request.model, gen_ai.response.model, gen_ai.usage.input_tokens, gen_ai.usage.output_tokens, gen_ai.response.finish_reasons | Captures individual model inference rounds, token consumption, latency-to-first-token, and stop conditions. |
execute_tool | execute_tool {gen_ai.tool.name} | gen_ai.tool.name, gen_ai.tool.call.id, gen_ai.tool.type | Isolates deterministic tool and API executions, binding external side effects to the exact model turn that requested them. |
By correlating gen_ai.conversation.id across multi-turn sessions and linking gen_ai.tool.call.id to downstream transactional idempotency keys, engineering teams create an immutable audit trail. This directly complements the verification guarantees outlined in our guide to Speculative Agent Execution and Semantic Verification, allowing verifiers to roll back speculative child spans without polluting committed telemetry.
How Do Production Pipelines Redact PII While Preserving Debuggability?
A critical tension in agent observability is balancing deep root-cause debugging against strict data privacy and zero-data-retention (ZDR) obligations. Recording raw prompts (gen_ai.input.messages) and tool outputs (gen_ai.tool.call.result) directly into observability backends risks leaking customer PII, privileged legal records, or credentials into telemetry storage.
Production-grade OpenTelemetry architectures resolve this through a three-tier collector governance pipeline:
- Metadata-First Default Instrumentation: By default, production spans emit structural attributes—trace IDs, span durations, model identifiers, token counts, finish reasons, tool names, and error classifications—while omitting raw prompt and completion payloads.
- Inline Collector PII Scrubbing and Hashing: Before telemetry leaves the execution boundary, OpenTelemetry Collector processors apply deterministic regex and named-entity redaction, replacing sensitive identifiers with salted cryptographic hashes. This preserves correlation across spans without exposing plaintext content.
- Tail-Based Sampling with Encrypted Vault Pointers: Rather than capturing full payloads on healthy runs, tail-based sampling evaluates the complete trace outcome. When a trace triggers a guardrail violation, tool failure, or latency breach—such as those monitored in Production AI Agent Evaluation Pipelines—the collector writes the diagnostic payload to a tenant-isolated, short-TTL encrypted vault and attaches only the vault pointer URI to the exported span.
What is the difference between invoke_agent and chat spans in OpenTelemetry?
An invoke_agent span represents the high-level lifecycle of an autonomous agent or sub-agent handling a task, which may encompass multiple reasoning loops, memory retrievals, and tool calls. A chat span is a child span nested inside invoke_agent that records a single invocation to an underlying foundation model, tracking specific model parameters, finish reasons, and token usage.
How do distributed traces handle human-in-the-loop approval pauses?
When an agent workflow pauses for human authorization, the runtime serializes the active W3C traceparent and gen_ai.conversation.id into the persistent checkpoint store. Once the user approves the action—hours or days later—the resumed worker extracts the stored context and starts a new linked span under the original trace ID, preserving end-to-end causal continuity without holding open long-lived network connections.
Does OpenTelemetry GenAI tracing increase model inference latency?
No. Span creation, context propagation, and attribute recording occur asynchronously in memory taking microseconds, while batch span processors export telemetry out-of-band to the OpenTelemetry Collector. Consequently, distributed tracing adds negligible overhead compared to network transport and model token generation.